
Graph Engineering
Store company knowledge as things and relationships, not as loose chunks of text. This is what makes it possible to answer a question that spans multiple records.
In one sentence
The practice of organizing company knowledge as a graph, with entities and the relationships between them, instead of just a pile of documents cut into chunks.
Before
Loose chunks, each unaware of the others
What it does
Explicit entities and relationships
After
A question spanning records gets an answer
Analogy
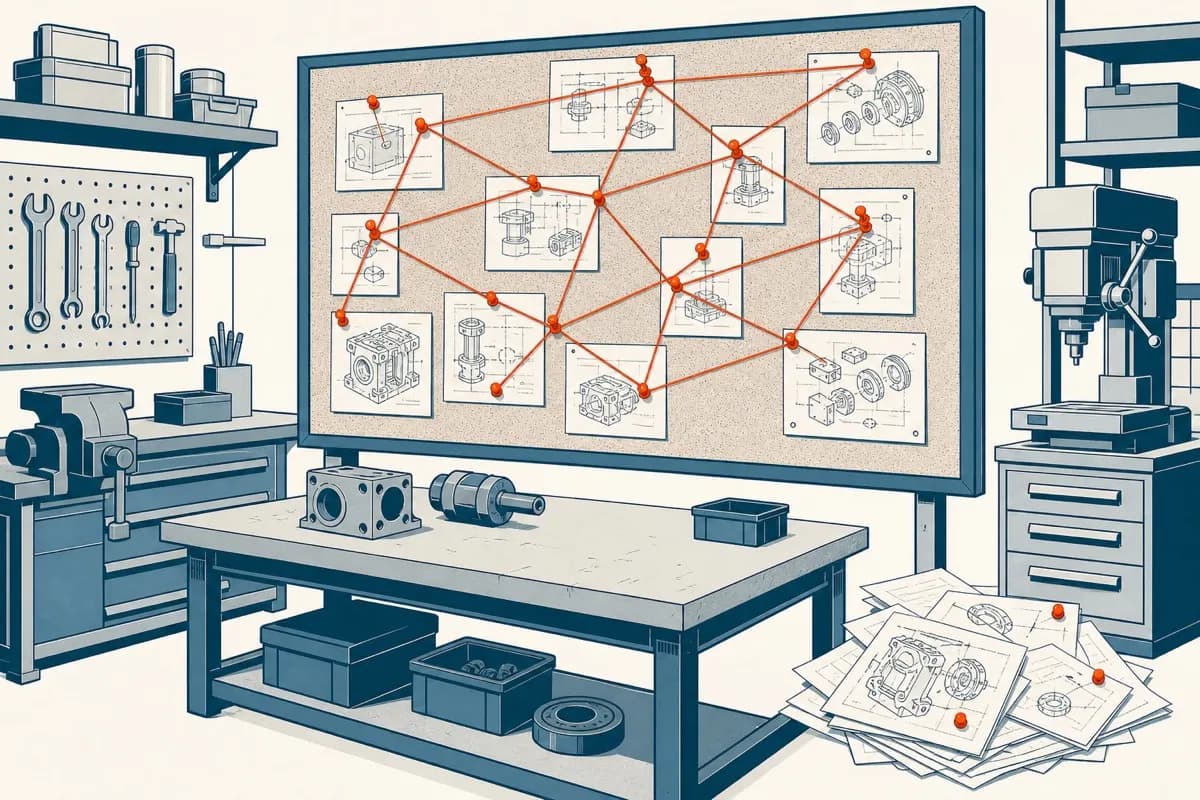
Compare a stack of index cards with an investigation board where string connects the cards. The cards alone answer “what does it say here.” The board with string answers “who is connected to whom.”
Example
Ask a standard RAG / Retrieval: “how many children in the North region changed sponsors after going more than 60 days without a letter?”
It will look for the chunks most similar to the question and return something plausible. But the answer is not in any one chunk. It depends on the relationship between child, region, letter, date, and sponsor, spread across four records that no chunk brings together.
In the graph, child and sponsor are entities, “received letter on” is a relationship with a date, and the question becomes a path to traverse, with an answer that can be verified.
The common mistake
Building the graph before you have the Ontology. Graph is the form; ontology is the agreement on what things are. Without that agreement, you build a nice-looking graph where “child” means three different things depending on who entered the record, and the path it traverses produces wrong answers that look precise.
The other mistake is the opposite: thinking you need a graph for everything. Most company questions are answered by simple search. Graph is justified when the question spans records.
In practice
- Start with the entities that appear in every listening conversation. They
repeat for a reason.
- A relationship also needs a name and a direction. Calling everything “related to”
is giving up on saying what the relationship is.
- Put a date on the relationship, in addition to the entity. Almost every interesting question has
“when” inside it.
- Let the graph grow from the questions that arise. A graph built to be
complete is never finished.
How to make it tangible
A file that lists the entities, the attributes of each one, and the possible relationships between them, as well as the tables or database that materialize it. If it is only in a diagram, it is still just a drawing.
Note
Do not confuse this with a graph database. You can do this in a regular relational table, and in a forty-person company you probably should. The value comes from declaring the entities and relationships, whatever technology stores them.
To test: if answering a question requires a human bringing together two screens, that relationship is not yet in the graph.
Connects with
Translated from Portuguese with AI assistance.